U.S. flag

An official website of the United States government

Government Website

Official websites use .gov
A .gov website belongs to an official government organization in the United States.

Safely connect using HTTPS

Secure .gov websites use HTTPS
A lock () or https:// means you’ve safely connected to the .gov website. Share sensitive information only on official, secure websites.

Archived Content

In an effort to keep DHS.gov current, the archive contains outdated information that may not reflect current policy or programs.

Notice

This page and its content reflects language used at the time of publication and may include terminology no longer used by the Department.

Infographics 2014

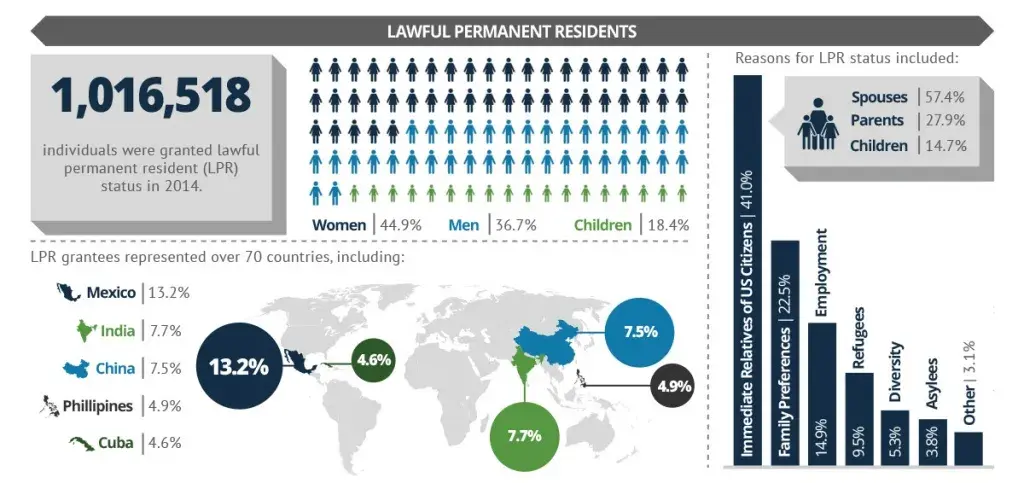
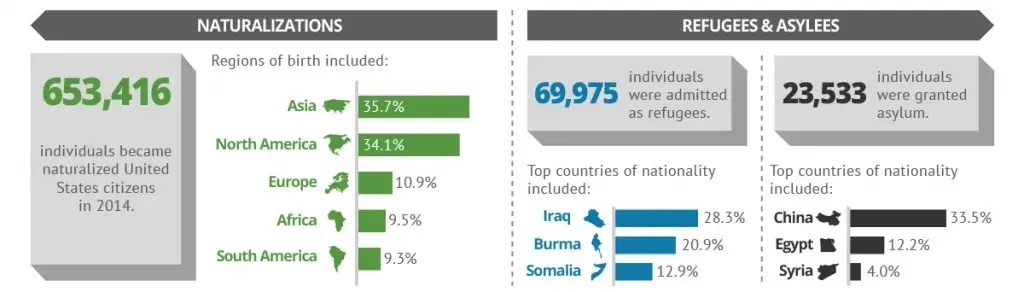
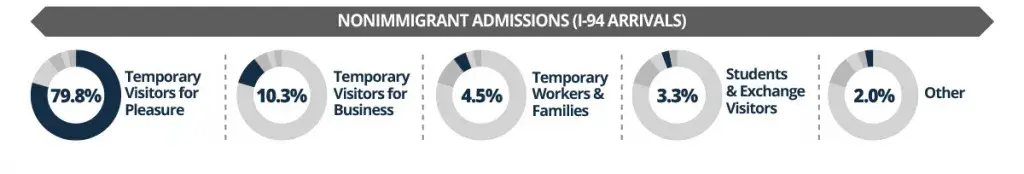
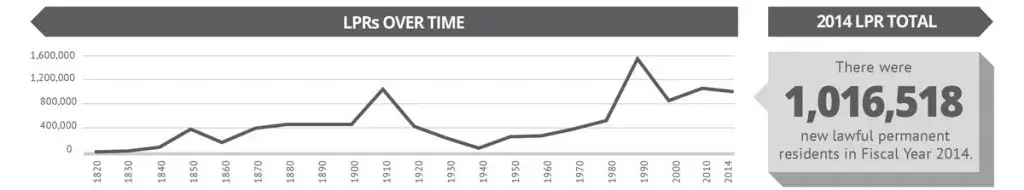
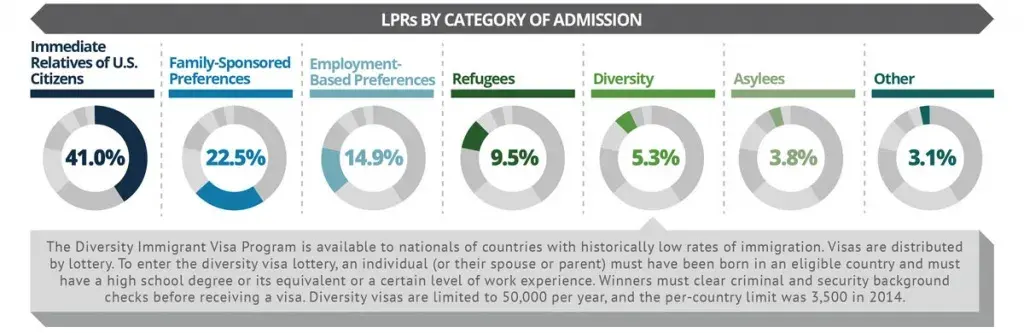
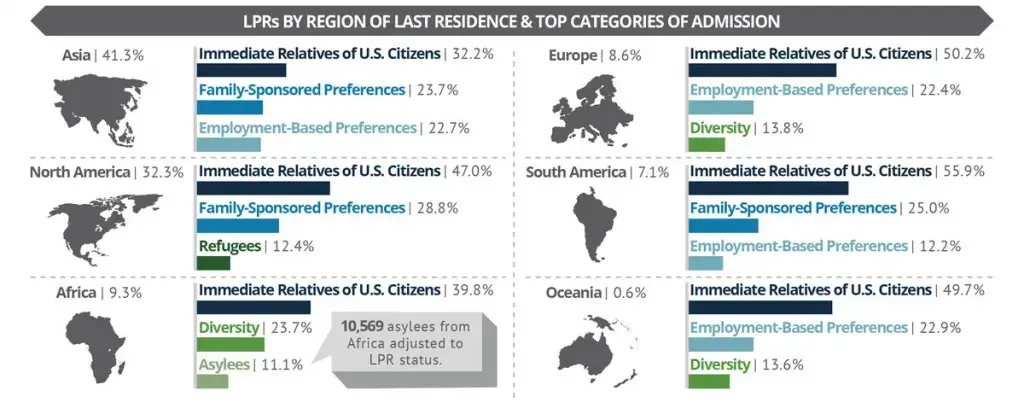
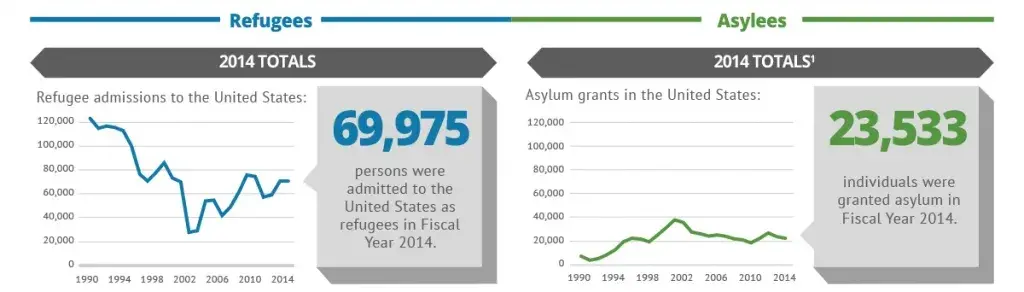
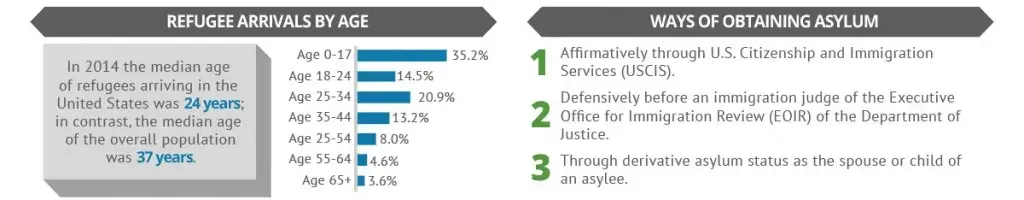
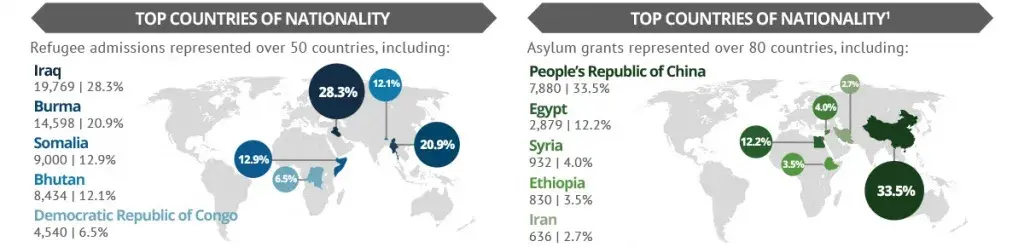
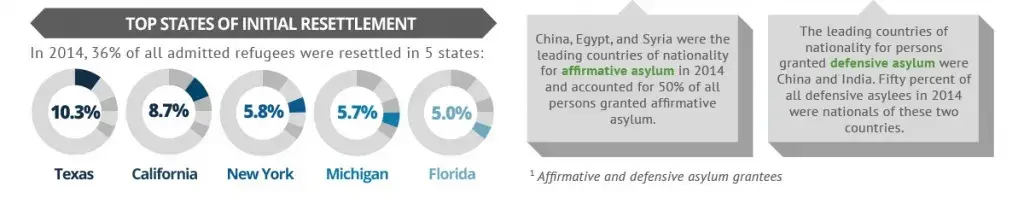
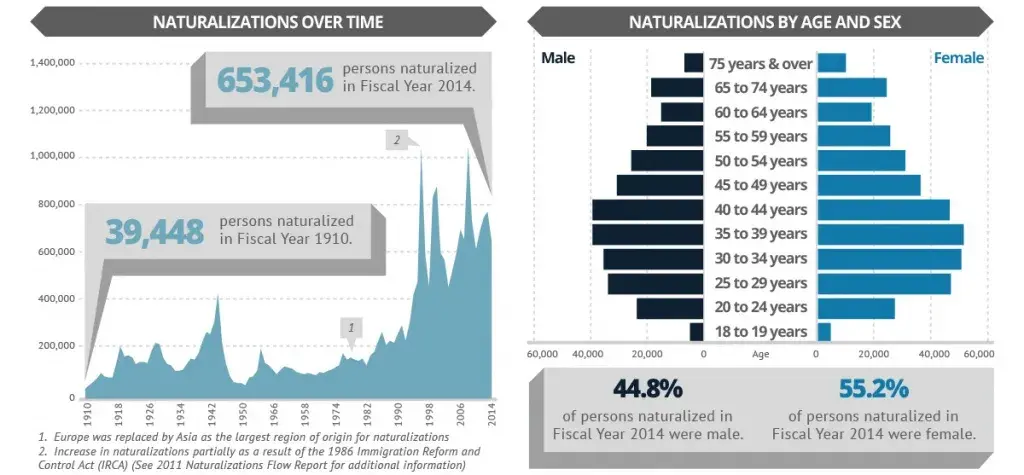
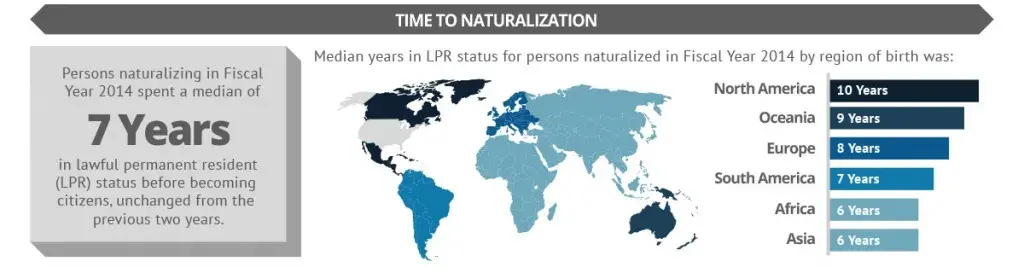
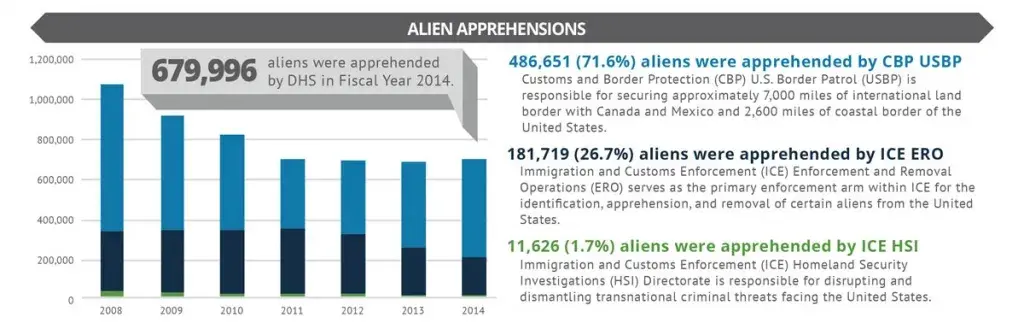
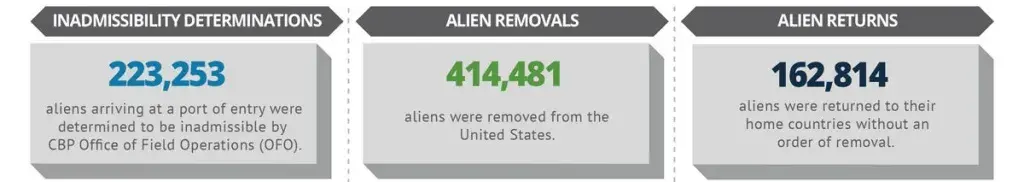
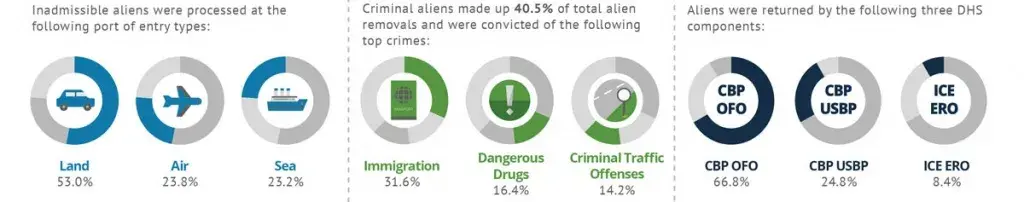
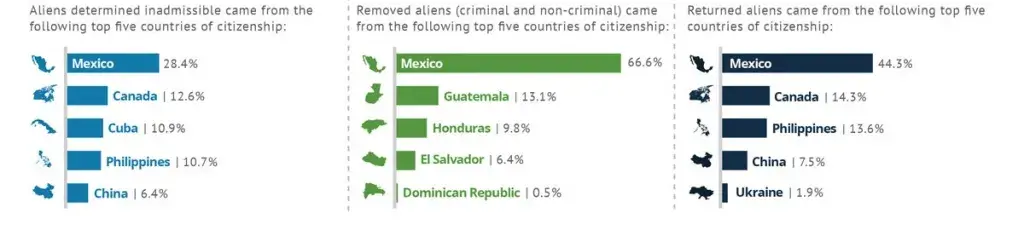
This gallery contains infographics produced by the Office of Immigration Statistics to make data provided by Department of Homeland Security components more readily available to the public. Infographics describe key immigration topics such as the number and characteristics of lawful permanent residents, refugees and asylees, naturalizations, nonimmigrant admissions, and immigration enforcement actions. Infographics for 2014 may be viewed below or downloaded.

The U.S. Immigration System by the numbers. 2014 Immigration Benefits Infographic.

The Office of Immigration Statistics (OIS) reports on several main types of immigration benefits for foreign-born persons: lawful permanent residence (LPR), refugee arrivals, grants of asylum, naturalizations, and temporary admissions of nonimmigrants. This graphics provides information for these categories for Fiscal Year 2014.

1,016,518 individuals were granted lawful permanent resident (LPR) status in 2014. 44.9% of those were women, 36.7% were men, and 18.4% were children. LPR grantees represented over 70 countries, including: 13.2% from Mexico, 7.7% from India, 7.5% from China, 4.9% from The Philippines, and 4.6% from Cuba. Reasons for LPR status included: 41% from Immediate Relatives of US Citizens, 22.5% from Family Preferences, 14.9% from Employment, 9.5% from Refugees, 5.3% from Diversity, and 3.8% from Asylees.

653,416 individuals became naturalized United States citizens in 2014. Regions of birth included: 35.7% from Asia, 34.1% from North America, 10.9% from Europe, 9.5% from Africa, and 9.5% from South America. 69,975 individuals were admitted as refugees. Top countries of nationality included: Iraq at 28.3%, Burma at 20.9%, and Somalia at 12.9%. 23,533 individuals were granted asylum. Top countries of nationality included: China at 33.5%, Egypt at 12.2%, and Syria at 4%.

Of all nonimmigrant admissions (I-94 arrivals), 79.8% were Temporary Visitors for Pleasure, 10.3% were Temporary Visitors for Business, 4.5% were Temporary Workers and Families, 3.3% were Students and Exchange Visitors, and 2% were Other categories.

For more information, please see the 2014 Yearbook of Immigration Statistics at www.dhs.gov/immigration-statistics.

The U.S. Immigration System by the numbers. 2014 Lawful Permanent Residents Infographic.

A lawful permanent resident (LPR) or "green card" recipient is defined by immigration law as a person who has been granted lawful permanent residence in the United States. Lawful Permanent Residents may live and work permanently anywhere in the United States; own property; attend public schools, colleges, and universities; join the U.S. Armed Forces; and apply to become a U.S. citizen after meeting certain eligibility requirements. This graphic provides information on those who received LPR status in Fiscal year 2014.

There were 1,016,518 new lawful permanent residents in Fiscal Year 2014. LPR's have increased steadily over time, with the largest number of LPRs in the late 1980s.

Immediate Relatives of U.S. citizens account for 41% of LPRs in 2014. 22.5% were Family Sponsored Preferences; 14.9% were Employment-Based Preferences; 9.5% were Refugees; 5.3% were Diversity; 3.8% were Asylees; and 3.1% were other categories. The Diversity Immigrant Visa Program is available to nationals of countries with historically low rates of immigration. Visas are distributed by lottery. To enter the diversity visa lottery, an individual (or their spouse or parent) must have been born in an eligible country and must have a high school degree or its equivalent or a certain level of work experience. Winners must clear criminal and security background checks before receiving a visa. Diversity visas are limited to 50,000 per year, and the per-country limit was 3,500 in 2014.

Asia accounted for 41.3% percent of LPRs by Region of Last Residence in 2014. North America was 32.3%; Africa was 9.3%; Europe was 8.6%; South America was 7.1%; and Oceania was 0.6%. Immediate Relatives of U.S. Citizens was the leading category of admission in all regions.

For more information, please see the 2014 Yearbook of Immigration Statistics and 2014 Lawful Permanent Residents Flow Report at www.dhs.gov/immigration-statistics.

The U.S. Immigration System by the numbers. 2014 Refugees & Asylees infographic.

The United States provides refuge to persons who have been persecuted or have a well-founded fear of persecution through two programs: a refugee program for persons outside the United States and an asylum program for persons in the United States and their immediate relatives. This infographic provides information on person admitted as refugees or granted asylum in the United States in Fiscal Year 2014.

69,975 persons were admitted to the United States as refugees in Fiscal Year 2014. 23,533 individuals were granted asylum in Fiscal Year 2014.

Refugee Arrivals by Age. In 2014 the median age of refugees arriving in the United States was 24 years; in contrast the median age of the overall population was 37. In 2014, 35.2% of Arrivals were 0-17 years old; 14.5% were 18-24; 20.9% were 25-34; 13.2% were 35-44; 8% were 45-54; 4.6% were 55-64;  and 3.6% were 65 and over. Ways of obtaining asylum: 1. Affirmatively through U.S. Citizenship and Immigration Services (USCIS). 2. Defensively before an immigration judge of the Executive Office for Immigration Review (EOIR) of the Department of Justice. 3. Through derivative asylum status as the spouse or child of an asylee.

Refugee admissions represented over 50 countries, including: Iraq with 19,769 or 28.3% of the total; Burma with 14,598 or 20.9%; Somalia with 9,000 or 12.9%; Bhutan with 8,434 or 12.1%; and Democratic Republic of Congo with 4,540 or 6.5%. Asylum grants represented over 80 countries, including: People's Republic of China with 7,880 or 33.5% of the total; Egypt with 2,879 or 12.2%; Syria with 932 or 4%; Ethiopia with 830 or 3.5%; Iran with 636 or 2.7%.

In 2014, 36% of all admitted refugees were resettled in 5 states: 10.3% in Texas, 8.7% in California, 5.8% in New York, 5.7% in Michigan, and 5% in Florida. China, Egypt, and Syria were the leading countries of nationality for affirmative asylum in 2014 and accounted for 50% of all persons granted affirmative asylum. The leading countries of nationality for persons granted defensive asylum were China and India. Fifty percent of all defensive asylees in 2014 were nationals of these two countries.

For more information, please see the 2014 Yearbook of Immigration Statistics and 2014 Refugee and Asylee Flow Report at www.dhs.gov/immigration-statistics.

The U.S. Immigration System by the numbers. 2014 Naturalizations infographic.

The naturalization process confers U.S. citizenship upon foreign citizens or nationals who have fulfilled the requirements established by Congress in the Immigration and Nationality Act (INA). After naturalization, foreign-born citizens enjoy nearly all of the same benefits, rights, and responsibilities that the Constitution gives to native-born U.S. citizens, including the right to vote. This graphic provides information for persons who naturalized in Fiscal Year 2014.

653,416 persons naturalized in Fiscal Year 2014 compared to 39,448 naturalized in Fiscal Year 1910. Europe was replaced by Asia in the late 1970's as the largest region of origin for naturalizations. The Increase in naturalizations in the 1990's were partially as a result of the 1986 Immigration and Reform Control Act (IRCA). 44.8% of persons naturalized in Fiscal Year 2014 were male and 55.2% were female.

Persons naturalizing in Fiscal Year 2014 spent a median of 7 years in lawful permanent resident (LPR) status before becoming citizens, unchanged from the previous two years. Median years in LPR status for persons naturalized in Fiscal Year 2014 by region of birth was: North America, 10 years; Oceania, 9 years; Europe, 8 years; South America, 7 years; Africa and Asia, 6 years.

The top five countries of birth are: Mexico at 14.5%, India at 5.8%, Philippines at 5.3%, China at 4.6%, and Cuba at 3.7%. The top five states of residence are: California at 21.5%, Florida at 12.2%, New York at 11.9%, Texas at 8.1%, and New Jersey at 5%.

For more information, please see the 2014 Yearbook of Immigration Statistics and 2014 Naturalizations Flow Report at www.dhs.gov/immigration-statistics.

The U.S. Immigration System by the numbers. 2014 I-94 Nonimmigrant Admissions infographic.

Nonimmigrants are foreign nationals granted temporary admission to the United States. Some examples of nonimmigrant admission categories are tourists and business travelers, students, temporary workers, and diplomatic and international organization staff. This graphic provides data for nonimmigrants who received I-94 and I-94W forms in Fiscal Year 2014; these forms are issued to most types of nonimmigrants with the important exceptions of Canadian tourists and business travelers and Mexicans with border crossing cards.

74,930,606 individuals were admitted to the United States using Form I-94 or I-94W. An I-94/I-94W is a form denoting the Arrival-Departure Record of particular aliens.

I-94/I-94W admissions by class of admissions. Temporary visitors for pleasure, 79.8%. Temporary visitors for business, 10.3%. Temporary workers & families, 4.5%. Students and exchange visitors 3.3%, Others, 2%.

22,305,757 or 29.8% I-94W admissions participated in the Visa Waiver Program. The Visa Waiver Program allows nationals of designated countries to travel to the United States as tourists or business travelers without a visa for a period not to exceed 90 days. an average or 7,421,479 I-94/I-94W admissions entered the United States in July and August 2014. 4,999,169 I-94/I-94W admissions entered the United Stated in February.

I-94/I-94W admissions came from the following regions: North America, 47.5%; Europe, 23.2%; Asia, 17.8%; South America, 8.1%; Oceania, 2.4%; Africa, 1%. 52.3% of temporary workers and families were citizens of countries in North America. 48% of all students and exchange visitors were citizens of countries in Asia.

For more information, please see the 2014 Yearbook of Immigration Statistics and 2014 Nonimmigrant Admissions Flow Report at www.dhs.gov/immigration-statistics.

The U.S. Immigration System by the numbers. 2014 Immigration Enforcement Actions Infographic.

The U.S. Department of Homeland Security Office of Immigration Statistics reports on several immigration enforcement actions including apprehensions, arrests, determinations of inadmissibility, removals, and returns of unauthorized immigrants. This graphic provides information for these categories for Fiscal Year 2014.

679,996 aliens were apprehended by DHS in Fiscal Year 2014. 71.6% percent of that were apprehended by Customs and Border Protection (CBP) U.S. Border Patrol (USBP). CBP USBP is responsible for securing approximately 7,000 miles of international land border with Canada and Mexico and 2,600 miles of coastal border of the United States. 26.7% percent of the total 679,996 aliens were apprehended by Immigration and Customs Enforcement (ICE) Enforcement and Removal Operations (ERO). ICE ERO serves as the primary enforcement arm within ICE for the identification, apprehension, and removal of certain aliens from the United States. 1.7% of aliens were apprehended by Immigration and Customs Enforcement (ICE) Homeland Security Investigations (HSI) Directorate. ICE HSI is responsible for disrupting and dismantling transnational criminal threats facing the United States.

223,253 aliens arriving at a port of entry were determined to be inadmissible by CBP Office of Field Operations (OFO). 414,481 aliens were removed from the United States. 162,814 aliens were returned to their home countries without an order of removal.

Inadmissible aliens were processed at the following port of entry types: 53% by Land, 23.8% by Air, and 23.2% by Sea. Criminal aliens made up 40.5% of total alien removals and were convicted of the following top crimes: 31.6% are Immigration, 16.4% are Dangerous Drugs, and 14.2% are Criminal Traffic Offenses. Aliens were returned by the following three DHS components: 66.8% by CBP OFO, 24.8% by CBP USBP, and 8.4% by ICE ERO.

Aliens determined inadmissible came from the following top 5 countries of citizenship: 28.4% from Mexico, 12.6% from Canada, 10.9% from Cuba, 10.7% from The Philippines, and 6.4% from China. Removed aliens (criminal and non-criminal) came from the following top five countries of citizenship: 66.6% from Mexico, 13.1% from Guatemala, 9.8% from Honduras, 6.4% from El Salvador, and 0.5% from Dominican Republic. Returned aliens came from the following top five countries of citizenship: 44.3% from Mexico, 14.3% from Canada, 13.6% from The Philippines, 7.5% from China, and 1.9% from Ukraine.

For more information, please see the 2014 Yearbook of Immigration Statistics at www.dhs.gov/immigration-statistics.

Last Updated: 11/17/2023
Was this page helpful?
This page was not helpful because the content